The Awesome Oscillator is a technical analysis indicator used to measure market momentum. It helps traders compare recent price momentum with longer-term momentum, then displays the result as a histogram around a zero line.
The indicator was developed by Bill Williams, a well-known trader and market analyst. Traders use it to identify bullish momentum, bearish momentum, possible reversals, and trend confirmation.
The Awesome Oscillator is popular because it is visually simple. When the histogram moves above the zero line, short-term momentum is stronger than longer-term momentum. When it moves below the zero line, short-term momentum is weaker than longer-term momentum.
However, the Awesome Oscillator is not a guaranteed trading signal. Like every indicator, it can give false signals, especially in choppy markets. Traders should use it with price action, support and resistance, trend analysis, volume, risk management, and wider market context.
This guide explains what the Awesome Oscillator is, how it works, how to calculate it, how traders use it, and the main strategies built around it.
What Is the Awesome Oscillator?
The Awesome Oscillator, often shortened to AO, is a momentum indicator that compares a short-term simple moving average with a longer-term simple moving average.
It is displayed as a histogram above and below a zero line.
The indicator is designed to show whether short-term market momentum is stronger or weaker than longer-term momentum.
In simple terms:
- AO above zero suggests bullish momentum.
- AO below zero suggests bearish momentum.
- Rising bars suggest momentum is increasing.
- Falling bars suggest momentum is weakening.
The Awesome Oscillator can be used in forex, stocks, commodities, indices, crypto, and other traded markets. It is especially common among traders who use technical analysis to confirm trends and spot possible reversals.
Who Created the Awesome Oscillator?
The Awesome Oscillator was developed by Bill Williams.
Bill Williams created several technical indicators and trading concepts focused on market psychology, momentum, trend behaviour, and chaos theory.
The Awesome Oscillator is one of his best-known tools because it gives traders a simple visual way to read momentum.
How the Awesome Oscillator Works
The Awesome Oscillator works by comparing two simple moving averages of the median price.
Unlike many indicators that use closing prices, the Awesome Oscillator uses the median price of each period.
The median price is calculated as:
High price plus low price, divided by two.
This gives the midpoint of the trading range for that period.
The Awesome Oscillator then compares:
- A 5-period simple moving average of the median price
- A 34-period simple moving average of the median price
The difference between these two moving averages becomes the AO value.
That value is plotted as a histogram.
Awesome Oscillator Formula
The Awesome Oscillator formula is:
AO = 5-period SMA of median price − 34-period SMA of median price
Where:
Median Price = (High + Low) ÷ 2
This means the indicator does not directly use the closing price. It uses the midpoint between the high and low of each period.
Simple Example of the Awesome Oscillator Formula
Assume the 5-period simple moving average of the median price is 1.2050.
Assume the 34-period simple moving average of the median price is 1.2000.
The Awesome Oscillator value is:
1.2050 − 1.2000 = 0.0050
Because the value is positive, the histogram appears above the zero line. This suggests bullish momentum.
Now assume the 5-period SMA is 1.1980 and the 34-period SMA is 1.2000.
The AO value becomes:
1.1980 − 1.2000 = -0.0020
Because the value is negative, the histogram appears below the zero line. This suggests bearish momentum.
What the Awesome Oscillator Histogram Shows
The Awesome Oscillator is displayed as histogram bars.
Each bar represents the difference between short-term and long-term momentum for that period.
The histogram usually uses two colours:
| Histogram Bar | Meaning |
|---|---|
| Green bar | Current AO value is higher than the previous bar |
| Red bar | Current AO value is lower than the previous bar |
A green bar does not always mean price is rising. It means AO momentum is increasing compared with the previous bar.
A red bar does not always mean price is falling. It means AO momentum is decreasing compared with the previous bar.
This distinction is important because traders often misread indicator colours.
How to Read the Awesome Oscillator
The Awesome Oscillator is read by comparing the histogram with the zero line and by watching bar direction.
AO Above the Zero Line
When the Awesome Oscillator is above the zero line, the 5-period SMA is above the 34-period SMA.
This suggests short-term momentum is stronger than longer-term momentum.
Traders often interpret this as bullish.
AO Below the Zero Line
When the Awesome Oscillator is below the zero line, the 5-period SMA is below the 34-period SMA.
This suggests short-term momentum is weaker than longer-term momentum.
Traders often interpret this as bearish.
Rising AO Bars
Rising bars show that momentum is increasing.
If the bars are above zero and rising, bullish momentum may be strengthening.
If the bars are below zero and rising, bearish momentum may be weakening.
Falling AO Bars
Falling bars show that momentum is decreasing.
If the bars are above zero and falling, bullish momentum may be weakening.
If the bars are below zero and falling, bearish momentum may be strengthening.
Why Traders Use the Awesome Oscillator
Traders use the Awesome Oscillator because it can help answer three important questions:
- Is momentum bullish or bearish?
- Is momentum strengthening or weakening?
- Could the market be preparing for a reversal?
The AO can help traders confirm trends, avoid weak setups, and identify possible turning points.
However, it should not be used alone. Momentum can change quickly, and the AO can produce false signals during sideways markets.
Awesome Oscillator Trading Strategies
The three most common Awesome Oscillator strategies are:
| Strategy | Main Signal |
| Zero-line crossover | AO crosses above or below zero |
| Twin peaks | Reversal pattern based on two AO peaks |
| Saucer strategy | Short-term momentum continuation pattern |
Each strategy has different rules and risks.
Zero-Line Crossover Strategy
The zero-line crossover is the simplest Awesome Oscillator strategy.
It happens when the AO crosses above or below the zero line.
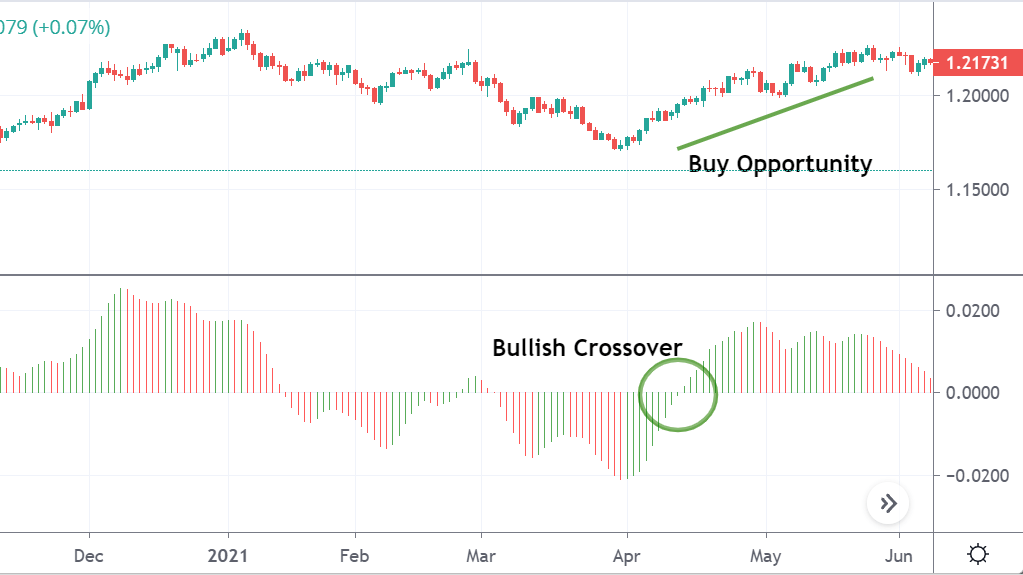
Bullish Zero-Line Crossover
A bullish crossover occurs when the AO moves from below zero to above zero.
This means the 5-period SMA has crossed above the 34-period SMA. Traders may see this as a sign that bullish momentum is increasing.
Example Bullish Setup
A trader watches EUR/USD on the one-hour chart.
Price has been consolidating near support. The Awesome Oscillator moves from below zero to above zero. At the same time, price breaks above a short-term resistance level.
A trader may consider a long trade only after confirmation.
A possible plan:
| Rule | Example |
| Entry | Buy after AO crosses above zero and price confirms breakout |
| Stop-loss | Below recent swing low |
| Take-profit | Next resistance zone |
| Risk | 1% of account |
| Confirmation | Price action supports AO signal |
Bearish Zero-Line Crossover
A bearish crossover occurs when the AO moves from above zero to below zero.
This means the 5-period SMA has crossed below the 34-period SMA. Traders may see this as a sign that bearish momentum is increasing.
Example Bearish Setup
A stock has been struggling below resistance. Price forms a lower high, and the Awesome Oscillator crosses below zero.
A trader may consider a short setup if price also breaks support.
Strengths of the Zero-Line Strategy
The zero-line crossover is easy to understand. It gives a clear bullish or bearish momentum signal.
It can work well in trending markets.
Weaknesses of the Zero-Line Strategy
The strategy can give late signals because moving averages lag price.
In sideways markets, the AO may cross above and below zero repeatedly, creating false entries.
Twin Peaks Strategy
The twin peaks strategy looks for reversal signals using two peaks on the same side of the zero line.
There are two types:
- Bullish twin peaks
- Bearish twin peaks
Bullish Twin Peaks
A bullish twin peaks pattern forms below the zero line.
The rules are:
- The AO is below zero.
- Two lows or peaks form below the zero line.
- The second low is closer to zero than the first.
- The AO stays below zero during the pattern.
- A green bar appears after the second low.
This suggests bearish momentum is weakening and a bullish reversal may be forming.
Example Bullish Twin Peaks Setup
A currency pair is falling, but the Awesome Oscillator makes a second low that is less negative than the first.
This means price may still be weak, but downside momentum is fading.
A trader may wait for a green AO bar and a price break above short-term resistance before entering long.
Bearish Twin Peaks
A bearish twin peaks pattern forms above the zero line.
The rules are:
- The AO is above zero.
- Two highs or peaks form above the zero line.
- The second high is closer to zero than the first.
- The AO stays above zero during the pattern.
- A red bar appears after the second high.
This suggests bullish momentum is weakening and a bearish reversal may be forming.
Example Bearish Twin Peaks Setup
A stock is rising, but the AO makes a second high that is lower than the first.
This may show that buyers are losing strength.
A trader may wait for a red AO bar and a price break below support before considering a short trade.
Strengths of the Twin Peaks Strategy
The twin peaks strategy can help identify momentum divergence before a reversal becomes obvious on price alone.
It is useful when a trend is losing strength.
Weaknesses of the Twin Peaks Strategy
The pattern can appear too early. A market can keep trending even after momentum weakens.
Traders should not enter based only on AO peaks. They should wait for price confirmation.
Saucer Strategy
The saucer strategy looks for three consecutive AO bars on the same side of the zero line.
It is usually used as a continuation setup rather than a major reversal signal.
Bullish Saucer
A bullish saucer appears above the zero line.
The basic rules are:
- AO is above zero.
- Two red bars appear.
- The second red bar is lower than the first.
- A green bar appears after the two red bars.
This suggests bullish momentum paused briefly and may be resuming.
Bullish Saucer Example
A stock is in an uptrend. The AO is above zero. Two red bars show a brief pullback in momentum. Then a green bar appears.
A trader may consider a long position if price also holds support.
Bearish Saucer
A bearish saucer appears below the zero line.
The basic rules are:
- AO is below zero.
- Two green bars appear.
- The second green bar is higher than the first but still below zero.
- A red bar appears after the two green bars.
This suggests bearish momentum paused briefly and may be resuming.
Bearish Saucer Example
A forex pair is in a downtrend. AO remains below zero. Two green bars show a temporary momentum recovery. Then a red bar appears.
A trader may consider a short position if price rejects resistance.
Strengths of the Saucer Strategy
The saucer strategy helps traders join existing momentum after a short pause.
It can work well in trending markets.
Weaknesses of the Saucer Strategy
The saucer strategy can fail in choppy markets. It may produce continuation signals when the trend is already exhausted.
Awesome Oscillator vs MACD
The Awesome Oscillator and MACD are both momentum indicators, but they are not the same.
MACD stands for Moving Average Convergence Divergence. It usually compares two exponential moving averages and includes a signal line.
The Awesome Oscillator compares two simple moving averages of median price and uses a zero-line histogram.
| Feature | Awesome Oscillator | MACD |
| Moving average type | Simple moving averages | Exponential moving averages |
| Common settings | 5 and 34 periods | 12, 26, and 9 periods |
| Price input | Median price | Closing price |
| Display | Histogram around zero line | MACD line, signal line, histogram |
| Main use | Momentum and reversal signals | Trend momentum and signal-line crossovers |
Which Is Better: Awesome Oscillator or MACD?
Neither is always better.
The Awesome Oscillator is simple and useful for reading momentum changes around a zero line.
MACD gives more signal options because it includes a MACD line, signal line, and histogram.
Some traders use both. For example, they may use MACD to identify a momentum shift and AO to confirm whether broader momentum supports the trade.
However, using too many indicators can create confusion. Traders should understand why each tool is on the chart.
Awesome Oscillator and Divergence
Divergence occurs when price moves in one direction while the indicator moves in another.
Bullish Divergence
Bullish divergence occurs when price makes a lower low, but the Awesome Oscillator makes a higher low.
This suggests selling pressure may be weakening.
Bearish Divergence
Bearish divergence occurs when price makes a higher high, but the Awesome Oscillator makes a lower high.
This suggests buying pressure may be weakening.
Divergence can be useful, but it is not a direct entry signal. Markets can keep moving in the same direction even after divergence appears.
Best Markets for the Awesome Oscillator
The Awesome Oscillator can be used across several markets.
These include:
- Forex pairs
- Stocks
- Stock indices
- Commodities
- Metals
- Cryptocurrencies
- Exchange-traded funds
The indicator is most useful when the market has clear momentum.
It is less reliable in sideways markets where price moves back and forth without direction.
Best Timeframes for the Awesome Oscillator
The Awesome Oscillator can be used on many timeframes.
| Trader Type | Possible Timeframes |
| Scalper | 1-minute, 5-minute, 15-minute |
| Day trader | 15-minute, 30-minute, 1-hour |
| Swing trader | 4-hour, daily |
| Position trader | Daily, weekly |
Shorter timeframes produce more signals, but they also create more noise.
Higher timeframes produce fewer signals, but they may be more reliable.
Beginners may find it easier to practise on higher timeframes before moving to very short-term charts.
How to Use the Awesome Oscillator With Risk Management
The Awesome Oscillator should never replace risk management.
Before entering a trade, define:
- Entry price
- Stop-loss level
- Take-profit level
- Position size
- Risk per trade
- Market condition
- Reason for entry
- Exit rule if the signal fails
Position Sizing Example
Assume a trader has a $1,000 account and risks 1% per trade.
That means the maximum risk is $10.
If the stop-loss is 25 pips away, the trader needs a position size where 25 pips equals $10.
$10 ÷ 25 pips = $0.40 per pip
This keeps the risk near 1% if the stop-loss is hit.
Stop-Loss Placement
A stop-loss should be placed where the trade idea becomes invalid.
For a bullish AO signal, the stop may go below recent support or below a swing low.
For a bearish AO signal, the stop may go above recent resistance or above a swing high.
Do not place stop-losses randomly. They should reflect market structure.
Risk-Reward Ratio
A good setup should offer enough potential reward compared with the risk.
| Risk | Target | Risk-Reward Ratio |
| 20 pips | 20 pips | 1:1 |
| 20 pips | 40 pips | 1:2 |
| 20 pips | 60 pips | 1:3 |
Many traders prefer at least 1:1.5 or 1:2, but the right target depends on the strategy and market.
Common Mistakes Traders Make With the Awesome Oscillator
Using AO Alone
The Awesome Oscillator should not be used as a standalone system. It needs confirmation from price action, trend structure, support and resistance, or another analysis method.
Entering Every Zero-Line Cross
Not every crossover is meaningful. In sideways markets, zero-line crosses can happen repeatedly and produce false signals.
Ignoring Market Context
A bullish signal near major resistance may fail. A bearish signal near strong support may also fail.
Trading Against the Higher-Timeframe Trend
A short-term AO signal may look strong, but the higher timeframe may show the opposite trend.
Forgetting News Events
Economic data, earnings reports, central bank decisions, and geopolitical news can override technical signals.
Using Too Much Leverage
Even a good signal can lose. Large position sizes can damage an account quickly.
Advantages of the Awesome Oscillator
Simple Visual Display
The histogram makes it easy to see momentum changes.
Useful for Trend Confirmation
The AO can help confirm whether momentum supports the direction of price.
Works Across Markets
It can be applied to forex, stocks, commodities, indices, and other markets.
Helps Spot Potential Reversals
Twin peaks and divergence can help traders notice weakening momentum.
No Fixed Upper or Lower Limit
Because the AO is unbounded, it can adapt to strong trends without being capped like some oscillators.
Disadvantages of the Awesome Oscillator
Lagging Indicator
The AO is based on moving averages, so it reacts after price has already moved.
False Signals in Ranges
Sideways markets can create frequent misleading crossovers.
No Exact Overbought or Oversold Levels
Unlike RSI or stochastic, AO does not have fixed 70/30 or 80/20 levels.
Needs Confirmation
The AO is more useful when combined with price action and risk management.
Can Be Misread by Beginners
Green bars do not always mean buy. Red bars do not always mean sell.
Best Practices for Using the Awesome Oscillator
Use the Awesome Oscillator as a confirmation tool, not a magic signal.
Trade with the higher-timeframe trend when possible.
Combine AO signals with support and resistance.
Avoid using AO signals during major news unless your strategy is designed for news volatility.
Backtest the strategy before using real money.
Keep a trading journal to track which AO signals work best for your market and timeframe.
Use stop-losses and realistic targets.
Avoid adding too many indicators that duplicate the same momentum information.
Key Takeaways
- The Awesome Oscillator is a momentum indicator developed by Bill Williams.
- It compares a 5-period SMA with a 34-period SMA of median price.
- AO appears as a histogram above and below a zero line.
- AO above zero suggests bullish momentum.
- AO below zero suggests bearish momentum.
- Green bars show rising AO momentum.
- Red bars show falling AO momentum.
- Main AO strategies include zero-line crossover, twin peaks, and saucer setups.
- The indicator can help confirm trends and spot possible reversals.
- AO can produce false signals in sideways markets.
- It should be used with price action, support and resistance, and risk management.
- The Awesome Oscillator does not guarantee future market direction.
Frequently Asked Questions
What is the Awesome Oscillator?
The Awesome Oscillator is a technical indicator that measures market momentum by comparing a short-term moving average with a longer-term moving average.
Who created the Awesome Oscillator?
The Awesome Oscillator was created by Bill Williams.
What is the Awesome Oscillator formula?
The formula is the 5-period simple moving average of median price minus the 34-period simple moving average of median price.
What does AO above zero mean?
AO above zero means short-term momentum is stronger than longer-term momentum. Traders often interpret this as bullish.
What does AO below zero mean?
AO below zero means short-term momentum is weaker than longer-term momentum. Traders often interpret this as bearish.
What is a zero-line crossover?
A zero-line crossover happens when the AO moves above or below the zero line. It can suggest a momentum shift.
What is the twin peaks strategy?
The twin peaks strategy looks for two peaks on the same side of the zero line to identify possible momentum reversal signals.
What is the saucer strategy?
The saucer strategy looks for a three-bar pattern on the same side of the zero line to identify possible continuation signals.
Is the Awesome Oscillator better than MACD?
Not always. AO is simpler, while MACD offers more signal components. Some traders use both for confirmation.
Can the Awesome Oscillator be used in forex trading?
Yes. The Awesome Oscillator can be used on forex pairs, stocks, commodities, indices, and other markets.
Does the Awesome Oscillator repaint?
The completed bars do not usually repaint, but the current live bar can change while the candle is still forming.
Is the Awesome Oscillator reliable?
It can be useful, but it is not always reliable. It works best when combined with trend analysis, price action, and risk management.
Conclusion
The Awesome Oscillator is a useful momentum indicator for traders who want a simple way to compare short-term and long-term market strength. It shows whether momentum is bullish, bearish, increasing, or weakening.
Its main strategies include the zero-line crossover, twin peaks, and saucer setup. These can help traders identify trend confirmation, continuation opportunities, and possible reversals.
However, the Awesome Oscillator is not a complete trading system. It can lag because it is based on moving averages. It can also give false signals in sideways or news-driven markets.
The best way to use the Awesome Oscillator is as part of a wider trading plan. Combine it with price action, support and resistance, higher-timeframe analysis, stop-losses, position sizing, and clear risk rules.
Used correctly, the Awesome Oscillator can improve market reading. Used carelessly, it can create false confidence.
Trading forex, stocks, commodities, indices, and leveraged products involves significant risk and may not be suitable for all investors. Past performance does not guarantee future results. Always conduct your own research and consider seeking independent financial advice.
Read Also: Nuclear Fusion Stocks: How to Invest


