Standard deviation is a statistical measure that shows how much data varies from its average. In trading, it helps traders understand volatility by showing how far prices usually move from their mean.
A market with a high standard deviation has larger price swings. A market with a low standard deviation has smaller price swings. This makes standard deviation useful for analysing risk, setting stop-loss levels, comparing assets, building Bollinger Bands, and identifying quiet or volatile market conditions.
For example, a stock that moves sharply every day will usually have a higher standard deviation than a stable stock that moves slowly. A volatile commodity such as natural gas may show a higher standard deviation than a broad stock index. A major forex pair may have lower standard deviation during calm sessions and higher standard deviation around central bank decisions.
However, standard deviation does not predict direction. It does not tell you whether a market will rise or fall. It only measures how spread out prices or returns are compared with the average.
That is why traders should use standard deviation as a volatility and risk tool, not as a standalone buy or sell signal.
What Is Standard Deviation?
Standard deviation is a measure of variation within a set of data points.
In trading, those data points are often closing prices or returns over a chosen period. The average is usually the mean price or mean return for that period.
Standard deviation shows how far each price or return usually sits from the average.
In simple terms:
- High standard deviation means prices are spread far from the average.
- Low standard deviation means prices stay close to the average.
This helps traders understand whether a market is calm, active, risky, or unstable.
Standard Deviation Meaning in Trading
In trading, standard deviation is commonly used to measure volatility.
Volatility is the size and speed of price movement. If an asset moves sharply up and down, it is volatile. If it moves slowly and steadily, it is less volatile.
Standard deviation helps put that movement into a measurable form.
A trader can use it to answer questions such as:
- Is this market more volatile than usual?
- Has volatility increased or decreased?
- Should my stop-loss be wider or tighter?
- Is the market quiet enough for a breakout setup?
- Is the market too unstable for my strategy?
- Which asset carries more price risk?
Why Standard Deviation Matters
Standard deviation matters because volatility affects every trading decision.
A strategy that works in a calm market may fail in a volatile one. A stop-loss that is suitable for EUR/USD may be too tight for gold. A position size that is safe in a low-volatility stock may be too risky in a fast-moving commodity.
Standard deviation gives traders a way to compare volatility across assets and timeframes.
It can help with:
- Risk assessment
- Position sizing
- Stop-loss placement
- Take-profit placement
- Volatility trading
- Portfolio diversification
- Mean reversion strategies
- Bollinger Bands analysis
- Detecting quiet or flat markets
How Standard Deviation Works
Standard deviation works by measuring the distance between each data point and the average.
If most prices stay close to the average, standard deviation is low.
If prices move far above and below the average, standard deviation is high.
Simple Example
Assume two stocks have the same average price of $100.
Stock A usually trades between $99 and $101.
Stock B usually trades between $90 and $110.
Both may have the same average, but Stock B has much wider price swings. Therefore, Stock B has a higher standard deviation.
This means Stock B is more volatile and may require wider stops, smaller position sizes, and stronger risk controls.
Standard Deviation Formula
The standard deviation formula measures how far values are from the mean.
The common formula is:
Standard Deviation = Square Root of Variance
Variance is calculated by finding the average of the squared deviations from the mean.
In simplified trading terms, the process is:
- Find the average price.
- Subtract the average from each price.
- Square each result.
- Add the squared results together.
- Divide by the number of periods.
- Take the square root.
Most trading platforms calculate this automatically, so traders rarely need to do it manually.
How to Calculate Standard Deviation
Here is the step-by-step process.
Step 1: Find the Mean
The mean is the average of the data points.
If you are analysing closing prices, add all the closing prices together and divide by the number of periods.
Step 2: Find Each Deviation
Subtract the mean from each closing price.
This shows how far each price is from the average.
Step 3: Square Each Deviation
Each deviation is squared.
This removes negative signs and gives more weight to larger differences.
Step 4: Add the Squared Deviations
Add all squared deviations together.
This gives the total variation.
Step 5: Divide by the Number of Periods
Divide the total squared deviation by the number of periods.
This gives the variance.
Step 6: Take the Square Root
Take the square root of the variance.
The result is the standard deviation.
Standard Deviation Calculation Example
Assume a stock closes at these prices over five days:
| Day | Closing Price |
|---|---|
| 1 | $98 |
| 2 | $100 |
| 3 | $102 |
| 4 | $101 |
| 5 | $99 |
First, calculate the mean:
$98 + $100 + $102 + $101 + $99 = $500
$500 ÷ 5 = $100
The mean price is $100.
Now calculate each deviation:
| Day | Price | Deviation from Mean |
| 1 | $98 | -$2 |
| 2 | $100 | $0 |
| 3 | $102 | $2 |
| 4 | $101 | $1 |
| 5 | $99 | -$1 |
Now square each deviation:
| Deviation | Squared Deviation |
| -2 | 4 |
| 0 | 0 |
| 2 | 4 |
| 1 | 1 |
| -1 | 1 |
Add the squared deviations:
4 + 0 + 4 + 1 + 1 = 10
Divide by 5:
10 ÷ 5 = 2
Take the square root:
Square root of 2 = 1.41
The standard deviation is about 1.41.
This means the stock’s closing prices usually move around $1.41 from the average price during the period.
Standard Deviation and Volatility
Standard deviation is closely linked to volatility.
When price moves become larger, standard deviation rises.
When price movement becomes smaller, standard deviation falls.
High Standard Deviation
High standard deviation means the market is moving far from its average.
This may happen during:
- Earnings reports
- Interest rate decisions
- Inflation releases
- War or geopolitical events
- Commodity supply shocks
- Panic selling
- Strong breakouts
- Short squeezes
- Major news events
High standard deviation can create trading opportunity, but it also increases risk.
Low Standard Deviation
Low standard deviation means the market is moving close to its average.
This may happen during:
- Quiet sessions
- Low volume periods
- Market consolidation
- Holiday trading
- Waiting periods before major news
- Mature trends
- Sideways markets
Low standard deviation can suggest calm conditions. It can also suggest that a breakout may be building if price has been compressed for a long period.
How Traders Use Standard Deviation
Traders use standard deviation in several ways.
Risk Assessment
Standard deviation helps traders estimate how risky an asset may be.
An asset with high standard deviation has larger historical price swings. This means potential gains may be larger, but potential losses may also be larger.
For example, a volatile commodity may require wider stops than a large stock index.
Comparing Markets
Standard deviation can help compare markets.
A trader may compare:
- EUR/USD vs GBP/JPY
- Gold vs silver
- S&P 500 vs Nasdaq 100
- Tesla vs Coca-Cola
- Crude oil vs natural gas
- Bitcoin vs major forex pairs
The market with the higher standard deviation has historically shown wider movement.
Position Sizing
Position size should reflect volatility.
If standard deviation is high, a trader may reduce position size. If standard deviation is low, a trader may use normal size, depending on the strategy.
This helps keep account risk consistent.
Stop-Loss Placement
Standard deviation can help traders avoid placing stop-losses too close to normal market noise.
A volatile market may need a wider stop-loss. A calm market may allow a tighter stop-loss.
However, a wider stop-loss should usually be paired with a smaller position size.
Take-Profit Placement
Standard deviation can also help with profit targets.
If a market usually moves within a certain range, setting a target far beyond normal movement may be unrealistic.
A trader can use volatility to set targets that match the market’s behaviour.
Identifying Breakouts
Low standard deviation can show that price is compressed.
When volatility remains low for a long time, traders may watch for a breakout.
However, standard deviation does not show the direction of the breakout. Price can break up or down.
Standard Deviation and Bollinger Bands
Bollinger Bands are one of the most common indicators that use standard deviation.
Bollinger Bands usually include:
- A moving average in the middle
- An upper band
- A lower band
The upper and lower bands are often placed two standard deviations above and below the moving average.
How Bollinger Bands Use Standard Deviation
When volatility increases, the bands widen.
When volatility decreases, the bands narrow.
This gives traders a visual way to see changing volatility.
Bollinger Band Example
If a stock becomes more volatile, its standard deviation rises. The upper and lower Bollinger Bands move farther apart.
If the stock becomes quiet, standard deviation falls. The bands move closer together.
Traders may use this information to identify:
- Overextended moves
- Breakout setups
- Mean reversion opportunities
- Volatility expansion
- Volatility contraction
Standard Deviation and Mean Reversion
Mean reversion is the idea that prices may return toward their average after moving too far away.
Standard deviation helps traders identify when price has moved unusually far from the mean.
For example, if price moves far above its average, a mean reversion trader may watch for signs that the move is overextended.
If price moves far below its average, the trader may watch for a possible bounce.
Mean Reversion Example
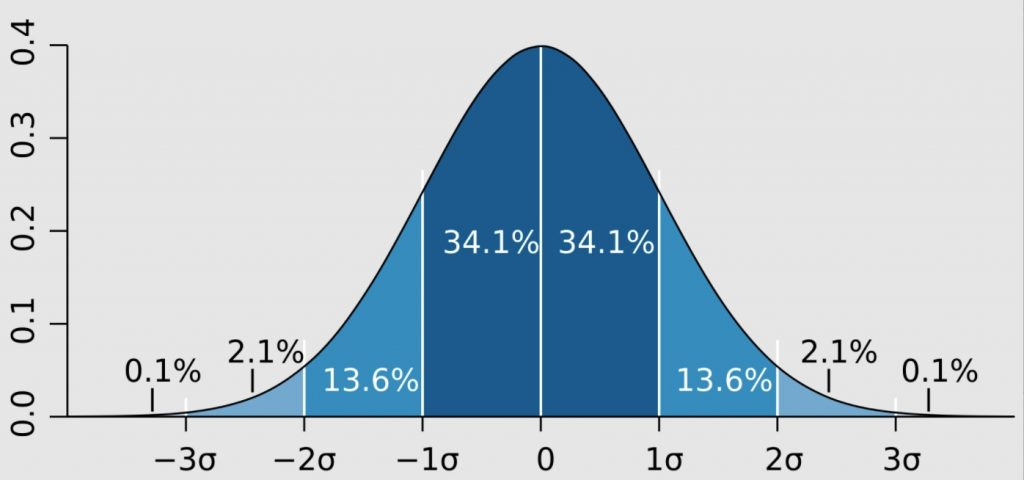
Assume a stock usually trades close to its 20-day moving average.
Suddenly, it moves three standard deviations above the average.
A trader may see this as an unusually stretched move. They may wait for weakness before considering a short trade or profit-taking signal.
However, strong trends can stay stretched for a long time. Mean reversion trades need confirmation and risk controls.
Standard Deviation and Trend Trading
Standard deviation can also help trend traders.
A rising standard deviation during a breakout may show that price movement is expanding.
This can support a trend-following setup if price also breaks a key level with strong momentum.
However, very high standard deviation after a long trend may also warn that the market is becoming unstable or overextended.
Standard Deviation and Market Tops
Standard deviation can help traders understand market tops.
A market top with rising standard deviation may show uncertainty. Traders may be fighting over direction, causing larger price swings.
A market top with falling standard deviation may suggest a mature bull market with slower movement.
However, this is not a guaranteed reversal signal. It is only a volatility clue.
Standard Deviation and Market Bottoms
Market bottoms can also show different volatility conditions.
A bottom with rising standard deviation may suggest panic selling.
A bottom with falling standard deviation may suggest disinterest, low volume, or a flat market.
In both cases, traders should wait for price confirmation before entering.
Standard Deviation Market Conditions Table
| Market Condition | Standard Deviation Behaviour | Possible Meaning |
| Market top with falling volatility | Decreasing standard deviation | Mature bull market |
| Market top with rising volatility | Increasing standard deviation | Trader uncertainty |
| Market bottom with falling volatility | Decreasing standard deviation | Low interest or flat market |
| Market bottom with rising volatility | Increasing standard deviation | Panic selling |
These are only interpretations. Traders should combine them with trend, volume, support, resistance, and market news.
Standard Deviation and Flat Markets
Flat markets can be difficult to trade.
Low standard deviation may show that price is not moving much. This can happen when volume is low, traders are waiting for news, or the market lacks direction.
However, not all flat markets are the same.
A low-volume flat market may be best avoided.
A high-volume flat market may suggest accumulation or distribution before a breakout.
Standard deviation should therefore be used with volume and price structure.
Standard Deviation and Diversification
Investors can use standard deviation to compare the volatility of assets in a portfolio.
A diversified portfolio may include assets with different volatility levels and different return patterns.
For example, a portfolio may combine:
- Stocks
- Bonds
- Cash
- Commodities
- Real estate funds
- International assets
Standard deviation helps investors understand how much each asset may contribute to overall portfolio risk.
Standard Deviation and Risk vs Return
A higher-return asset may also carry higher standard deviation.
This means the investor must decide whether the potential return is worth the volatility.
A stock that gains 30% but swings wildly may not suit a conservative investor. A bond fund with lower returns and lower standard deviation may suit someone who wants stability.
Standard deviation helps compare the risk side of that decision.
Standard Deviation in Forex Trading
Forex traders use standard deviation to measure currency pair volatility.
Some pairs move more than others.
For example, GBP/JPY is often more volatile than EUR/USD. Exotic pairs may have even wider movement and spreads.
A forex trader may use standard deviation to:
- Compare pair volatility
- Set stop-loss distances
- Avoid quiet sessions
- Watch for breakouts
- Identify overextended moves
- Adjust position size
Forex traders should also watch news events such as inflation data, central bank decisions, employment reports, and geopolitical developments.
Standard Deviation in Stock Trading
Stock traders use standard deviation to measure how much a stock moves compared with its average.
A high-growth technology stock may have higher standard deviation than a defensive utility stock.
Stock traders may use standard deviation to:
- Compare stock volatility
- Manage risk around earnings
- Build Bollinger Band strategies
- Find breakout candidates
- Detect unusual price movement
- Adjust trade size
Earnings reports can cause sudden jumps in standard deviation because price gaps can be large.
Standard Deviation in Index Trading
Stock indices often have lower standard deviation than individual stocks because they represent baskets of companies.
For example, the S&P 500 may be less volatile than a single high-growth stock because gains and losses across many companies can offset each other.
Index traders may use standard deviation to:
- Measure market volatility
- Compare different indices
- Analyse risk sentiment
- Set stop-losses
- Identify breakout conditions
- Study market tops and bottoms
Standard Deviation in Commodity Trading
Commodities can show high standard deviation because they are affected by real-world supply and demand.
Commodity volatility can be driven by:
- Weather
- War
- Sanctions
- Inventory data
- Production cuts
- Shipping disruptions
- Crop reports
- Energy demand
- Currency movement
Natural gas, crude oil, gold, silver, coffee, cocoa, and wheat can all experience sharp volatility.
Commodity traders should use standard deviation with caution because gaps and fast moves can occur.
Standard Deviation and Stop-Loss Strategy
Standard deviation can help traders place more realistic stop-loss levels.
A stop-loss should not be so tight that normal volatility triggers it too easily.
If a market normally moves $2 per day, a stop-loss $0.20 away may be too tight for a swing trade.
If a market normally moves $0.30 per day, a stop-loss $2 away may be too wide.
Standard deviation helps traders understand normal movement.
Stop-Loss Example
Assume a stock trades at $50.
Its recent standard deviation is $1.
A trader may decide that a stop-loss should allow for normal movement but still protect capital.
If the trader enters at $50, they may place a stop near $48.50, depending on support levels and strategy.
This is not automatic. Stop-loss placement should also consider chart structure.
Standard Deviation and Take-Profit Strategy
Standard deviation can also guide take-profit levels.
If a stock rarely moves more than $2 from its average, a $10 target may be unrealistic for a short-term trade unless a major catalyst exists.
Traders can use standard deviation to set targets that match typical volatility.
Take-Profit Example
Assume a currency pair usually moves 60 pips over the trader’s chosen timeframe.
A 200-pip target may be too ambitious for a short-term strategy unless volatility expands sharply.
The trader may instead target a realistic zone based on recent price movement and support or resistance.
Standard Deviation and Volatility Trading
Some traders focus specifically on volatility.
They may not care whether price rises or falls. Instead, they care whether volatility expands or contracts.
Options traders often use standard deviation and implied volatility to estimate expected price movement.
However, volatility trading can be complex. It may involve options, spreads, hedging, and advanced risk management.
Beginners should first understand basic volatility before trading complex derivatives.
Standard Deviation vs Average True Range
Standard deviation and Average True Range both measure volatility, but they do it differently.
| Indicator | What It Measures | Common Use |
| Standard deviation | Distance from the mean | Statistical volatility and Bollinger Bands |
| Average True Range | Average price range | Stop-loss placement and market movement |
ATR looks at trading ranges, including gaps. Standard deviation looks at variation around the average.
Many traders use both.
Standard Deviation vs Variance
Variance and standard deviation are closely related.
Variance is the average of squared deviations from the mean.
Standard deviation is the square root of variance.
Standard deviation is easier to interpret because it is expressed in the same units as the original data.
For example, if prices are measured in dollars, standard deviation is also measured in dollars.
Limitations of Standard Deviation
Standard deviation is useful, but it has important weaknesses.
It Does Not Show Direction
High standard deviation can happen during a strong rally or a sharp sell-off.
The indicator does not tell you whether the market is bullish or bearish.
It Can Be Distorted by Outliers
One extreme price move can increase standard deviation sharply.
This may make the market look more volatile than usual even if the move was caused by a one-time event.
It Uses Historical Data
Standard deviation is based on past prices or returns.
Future volatility may be very different.
It Treats Upside and Downside Moves the Same
Standard deviation measures variation, not whether the move is good or bad.
A strong upward move and a strong downward move can both increase standard deviation.
It Can Give False Comfort
Low standard deviation does not mean low risk forever.
A quiet market can suddenly become volatile after major news.
Common Mistakes Traders Make With Standard Deviation
Using It as a Buy or Sell Signal
Standard deviation measures volatility. It does not tell traders when to buy or sell by itself.
Ignoring Market Direction
A rising standard deviation needs context. Is price breaking out, selling off, or whipsawing?
Forgetting News Events
Economic data, earnings, and central bank decisions can change volatility suddenly.
Using the Same Stop-Loss in Every Market
Different markets have different volatility. Standard deviation can help adjust stops.
Ignoring Position Size
Wider stops require smaller positions if the trader wants to keep risk constant.
Treating Low Volatility as Safe
Low volatility can hide risk. Quiet markets can break out violently.
Best Practices for Using Standard Deviation
Use standard deviation as part of a wider trading plan.
Combine it with:
- Trend analysis
- Support and resistance
- Volume
- Moving averages
- Bollinger Bands
- ATR
- Economic calendar
- Risk-reward analysis
- Position sizing
Do not use standard deviation alone.
Check whether volatility is rising or falling.
Adjust stop-losses and position sizes when volatility changes.
Use realistic targets based on recent movement.
Be careful around news events.
Review how standard deviation behaves in your chosen market and timeframe.
Practical Trading Plan Using Standard Deviation
Here is a simple example.
A trader watches a stock trading near resistance. Bollinger Bands have narrowed, and standard deviation has fallen for several days. Volume begins to rise, and price closes above resistance.
The trader creates a plan:
| Plan Element | Example |
| Market | Stock |
| Setup | Low volatility breakout |
| Entry | Buy after close above resistance |
| Stop-loss | Below breakout level |
| Target | Next resistance zone |
| Confirmation | Rising volume |
| Risk | 1% of account |
| Exit rule | Exit if price falls back into range |
This plan uses standard deviation to identify volatility compression, but it still requires price confirmation.
Risk Management Example
Assume a trader has a $2,000 account and wants to risk 1% per trade.
Maximum risk:
$2,000 × 1% = $20
If volatility is low and the stop-loss is $0.50 away:
$20 ÷ $0.50 = 40 shares
If volatility rises and the stop-loss must be $1.00 away:
$20 ÷ $1.00 = 20 shares
This keeps the dollar risk the same while adjusting for volatility.
Advantages of Standard Deviation
Standard deviation has several advantages.
It is easy to calculate with trading platforms.
It helps measure volatility objectively.
It can be used across forex, stocks, commodities, indices, and portfolios.
It supports risk management.
It helps traders adjust stop-loss and take-profit levels.
It is used in popular indicators such as Bollinger Bands.
It helps identify quiet markets and volatile markets.
Disadvantages of Standard Deviation
Standard deviation also has disadvantages.
It does not show direction.
It can be distorted by outliers.
It is based on historical data.
It treats upside and downside moves equally.
It may lag changing market conditions.
It should not be used alone.
It can create false confidence if traders ignore market context.
Key Takeaways
- Standard deviation measures how far prices or returns move from their average.
- In trading, it is commonly used to measure volatility.
- High standard deviation means larger price swings.
- Low standard deviation means smaller price swings.
- Standard deviation does not predict direction.
- It can help with risk assessment, stop-loss placement, and position sizing.
- Bollinger Bands use standard deviation to show volatility around a moving average.
- Standard deviation can support mean reversion and breakout strategies.
- It can be applied to forex, stocks, indices, commodities, and portfolios.
- Outliers can distort standard deviation.
- Low standard deviation does not mean risk has disappeared.
- Standard deviation works best when combined with price action, volume, trend, and risk management.
Frequently Asked Questions
What is standard deviation in trading?
Standard deviation in trading measures how much prices or returns vary from their average over a chosen period.
What does high standard deviation mean?
High standard deviation means the market has larger price swings and higher volatility.
What does low standard deviation mean?
Low standard deviation means prices are moving closer to their average and volatility is lower.
Does standard deviation show market direction?
No. Standard deviation measures volatility, not direction. It does not tell you whether price will rise or fall.
How is standard deviation calculated?
It is calculated by finding the mean, measuring each value’s deviation from the mean, squaring the deviations, averaging them, and taking the square root.
Why do traders use standard deviation?
Traders use standard deviation to measure volatility, assess risk, set stop-losses, compare assets, and build indicators such as Bollinger Bands.
What indicators use standard deviation?
Bollinger Bands are one of the most popular indicators that use standard deviation.
Is standard deviation good for forex trading?
Yes. Forex traders can use it to compare currency pair volatility and adjust risk management.
Is standard deviation useful for stocks?
Yes. Stock traders can use standard deviation to measure volatility, especially around earnings, breakouts, and market stress.
Can standard deviation help with stop-loss placement?
Yes. It can help traders understand normal price movement and avoid placing stops too close to market noise.
What is the main weakness of standard deviation?
The main weakness is that it does not show direction. It also uses historical data and can be distorted by outliers.
Should beginners use standard deviation?
Yes, beginners can use it to understand volatility, but they should combine it with price action, support and resistance, and risk management.
Conclusion
Standard deviation is one of the most useful volatility tools in trading. It measures how far prices or returns move from their average, helping traders understand whether a market is calm, active, risky, or unstable.
A high standard deviation means price swings are wider. A low standard deviation means price movement is tighter. This information can help traders set better stop-losses, choose realistic targets, compare assets, manage position size, and understand market conditions.
However, standard deviation is not a complete trading system. It does not show direction, it can be distorted by outliers, and it is based on historical data. A market with low standard deviation can still become volatile without warning.
The best way to use standard deviation is as part of a wider trading plan. Combine it with trend analysis, support and resistance, volume, Bollinger Bands, ATR, economic news, and strict risk management.
Used correctly, standard deviation can help traders respect volatility and avoid treating all markets the same.
Trading forex, stocks, indices, commodities, options, futures, and leveraged products involves significant risk and may not be suitable for all investors. Prices can move quickly, and losses can exceed expectations when leverage is used. Past performance does not guarantee future results. Always conduct your own research and consider seeking independent financial advice.
Read Also: Apple Acquisitions: What Does Apple Own?


