
Market volatility describes how quickly and sharply prices move over a specific period. It is one of the most important concepts in trading because it creates both opportunity and risk.
When volatility is high, prices can move fast. Traders may see larger short-term opportunities, but losses can also grow quickly. When volatility is low, markets may move slowly, spreads may be tighter, and breakouts may be harder to find.
Volatility affects stocks, forex, commodities, indices, bonds, cryptocurrencies, and derivatives. It can be caused by economic data, politics, central bank decisions, company earnings, wars, supply shocks, interest rates, liquidity changes, and investor fear.
For traders, volatility is not automatically good or bad. It depends on the strategy, market, timeframe, position size, and risk plan. A prepared trader may use volatility to find better setups. An unprepared trader may lose money quickly by using too much leverage or trading without a stop-loss.
This guide explains what market volatility is, what causes it, how it is measured, which markets are often more volatile, and how traders can manage risk when prices move sharply.
What Is Market Volatility?
Market volatility is the rate and size of price movement in a financial market.
A market is considered volatile when its price changes quickly over a short period. A market is less volatile when price changes are smaller and more stable.
For example, a stock that moves 1% in a day may be considered normal. A stock that moves 15% in a day may be considered highly volatile.
Volatility does not only mean prices are falling. Prices can be volatile when they rise sharply, fall sharply, or swing in both directions.
Simple Definition of Market Volatility
Market volatility means how much and how fast a price moves.
High volatility means larger price swings.
Low volatility means smaller price swings.
Why Market Volatility Matters
Market volatility matters because it affects trading decisions, investment risk, position sizing, stop-loss placement, and emotional discipline.
A trader using the same position size in a calm market and a volatile market may take very different levels of risk. When price swings widen, stop-losses may need more room. If position size is not reduced, the trader may risk more money than intended.
Volatility also affects market psychology. During uncertain periods, investors may panic, hedge positions, reduce exposure, or move into safer assets. This can make prices move even faster.
What Causes Market Volatility?
Market volatility is usually caused by uncertainty. When traders and investors disagree strongly about future prices, markets can move sharply.
Several factors can trigger volatility.
Economic Data
Economic reports can move markets because they affect expectations for growth, inflation, interest rates, and corporate profits.
Important economic data includes:
- Inflation reports
- Employment figures
- GDP growth
- Retail sales
- Manufacturing data
- Consumer confidence
- Industrial production
- Housing data
- Trade figures
For example, if inflation comes in higher than expected, traders may expect a central bank to keep interest rates higher for longer. That can move stocks, bonds, currencies, gold, and commodities.
Central Bank Decisions
Central banks influence interest rates, money supply, borrowing costs, and investor sentiment.
Markets often react strongly to:
- Interest rate decisions
- Monetary policy statements
- Central bank speeches
- Inflation forecasts
- Quantitative easing or tightening
- Forward guidance
A surprise rate hike or a more hawkish policy statement can increase volatility quickly.
Political Events
Political decisions can affect taxes, trade, regulation, government spending, sanctions, and business confidence.
Examples include:
- Elections
- Trade disputes
- Budget announcements
- New laws
- Sanctions
- Government shutdowns
- Leadership changes
- Geopolitical conflicts
Political uncertainty can make investors reduce risk until the situation becomes clearer.
Company News
Individual stocks can become volatile after company-specific news.
Common triggers include:
- Earnings reports
- Profit warnings
- Analyst upgrades
- Analyst downgrades
- Dividend changes
- CEO resignations
- Product launches
- Lawsuits
- Mergers and acquisitions
- Regulatory investigations
A company can move sharply when results differ from market expectations.
Industry News
Entire sectors can become volatile after industry-wide events.
Examples include:
- Oil supply cuts affecting energy stocks
- Chip shortages affecting technology and car makers
- Drought affecting agricultural commodities
- Drug approval decisions affecting pharmaceutical stocks
- Regulation affecting banks or technology firms
- Commodity price shocks affecting miners and manufacturers
Liquidity Changes
Liquidity means how easily an asset can be bought or sold without causing a large price move.
Highly liquid markets usually have many buyers and sellers. Less liquid markets have fewer participants, so a single large order can move price more sharply.
Low liquidity often increases volatility.
This is why thinly traded stocks, exotic currency pairs, small cryptocurrencies, and some commodities can move more dramatically than major stock indices or major currency pairs.
Market Sentiment
Market sentiment describes whether traders feel confident or fearful.
When sentiment is positive, investors may buy riskier assets. When fear rises, they may sell risk assets and move into cash, bonds, gold, or safe-haven currencies.
Volatility often rises when fear increases.
The Cboe Volatility Index, or VIX, is widely used as a measure of expected near-term U.S. stock market volatility based on S&P 500 option prices. Cboe describes the VIX as a leading measure of market expectations for near-term volatility.
How Is Market Volatility Measured?
Market volatility can be measured in several ways. Traders and investors use different tools depending on the market and strategy.
Standard Deviation
Standard deviation measures how far prices or returns move away from their average.
A higher standard deviation means prices are moving farther from the average, which suggests higher volatility.
A lower standard deviation means prices are staying closer to the average, which suggests lower volatility.
Historical Volatility
Historical volatility measures how much an asset has moved in the past.
It uses past price data to estimate how volatile the market has been over a chosen period.
For example, a trader may compare 20-day volatility with 100-day volatility to see whether recent movement is higher or lower than normal.
Implied Volatility
Implied volatility comes from options prices. It reflects what options traders expect future volatility to be.
If options become more expensive, implied volatility often rises. If options become cheaper, implied volatility may fall.
Implied volatility is important in options trading because it affects option premiums.
VIX
The VIX is one of the best-known volatility indicators.
It measures expected 30-day volatility in the S&P 500 based on options prices.
Many traders call it a fear gauge because it often rises when stock markets fall or when investors expect larger price swings.
However, the VIX does not predict market direction. It measures expected volatility, not whether the market will rise or fall.
Average True Range
Average True Range, or ATR, measures the average trading range of an asset over a chosen period.
ATR helps traders understand how much a market typically moves.
For example, if a stock has an ATR of $2, it has recently moved about $2 per period on average.
Traders often use ATR to set stop-loss distances and position sizes.
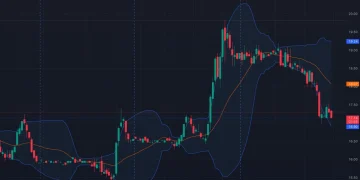
Bollinger Bands
Bollinger Bands are a popular volatility indicator.
They usually consist of:
- A moving average
- An upper band
- A lower band
The bands are usually placed a set number of standard deviations above and below the moving average.
When the bands widen, volatility is increasing. When the bands narrow, volatility is decreasing.
How Bollinger Bands Show Volatility
Bollinger Bands help traders see whether price movement is expanding or contracting.
If the bands are close together, the market may be quiet.
If the bands spread apart, the market may be entering a more volatile phase.
Some traders look for a “squeeze,” where the bands become very narrow before a possible breakout. However, a squeeze does not guarantee direction. Price can break upward or downward.
Most Volatile Markets
Volatility changes over time, but some markets are generally known for larger price swings than others.
The most volatile markets often include:
- Cryptocurrencies
- Commodities
- Small-cap stocks
- Growth stocks
- Emerging market assets
- Exotic currency pairs
- Options and leveraged products
Cryptocurrencies
Cryptocurrencies are often highly volatile.
Crypto markets can move sharply because of:
- Regulation news
- Exchange failures
- Security breaches
- Liquidity changes
- Social media sentiment
- Institutional flows
- Token supply changes
- Macro risk sentiment
- Leverage in derivatives markets
Crypto assets can trade 24 hours a day, which means price movement can happen while traditional markets are closed.
The CFTC warns that digital assets can involve risks such as fraud, hacking, and market volatility.
Commodities
Commodities can be volatile because they are driven by real-world supply and demand.
Important commodity markets include:
- Crude oil
- Natural gas
- Gold
- Silver
- Copper
- Wheat
- Corn
- Coffee
- Cocoa
- Sugar
Commodity volatility can be caused by:
- Weather
- Wars
- Sanctions
- Supply disruptions
- Inventory reports
- Production cuts
- Transport problems
- Currency movements
- Global demand changes
Energy commodities such as crude oil and natural gas can be especially volatile.
Exotic Currency Pairs
Major forex pairs such as EUR/USD and USD/JPY are usually very liquid. Their price movements can be fast, but they often move in smaller increments because many buyers and sellers are active.
Exotic currency pairs often have lower liquidity and wider spreads. This can make them more volatile.
Examples of exotic pair characteristics include:
- Wider bid-ask spreads
- Lower trading volume
- Higher sensitivity to local politics
- Greater central bank risk
- Sharper reactions to economic data
- More slippage during news events
Beginners should be careful with exotic pairs.
Small-Cap Stocks
Small-cap stocks can be more volatile than large-cap stocks because they often have lower liquidity, smaller market value, less analyst coverage, and higher business risk.
A small company’s share price can move sharply after one earnings report, funding announcement, contract win, or regulatory update.
Growth Stocks
Growth stocks can be volatile because investors price them based on future expectations.
When interest rates rise or growth expectations weaken, high-growth stocks can fall sharply.
When markets become confident, growth stocks can rally strongly.
Least Volatile Markets
Some markets are generally less volatile, although no market is risk-free.
Lower-volatility assets often include:
- Treasury bills
- Short-term government bonds
- Cash savings
- High-quality money market instruments
- Defensive large-cap stocks
- Some investment-grade bonds
However, even bonds can become volatile when interest rates change quickly.
Gold and silver are often viewed as safe-haven assets, but they are still commodities and can move sharply.
Volatility Trading Strategies
Volatility can be traded in different ways, depending on the market and product.
Breakout Trading
Breakout traders look for price to move beyond a key level after a period of compression.
A trader may watch Bollinger Bands narrow, then wait for price to break above resistance or below support.
Breakout Example
A stock trades between $48 and $50 for several days. Bollinger Bands narrow. Then the stock closes above $50 with strong volume.
A trader may consider a long trade, placing a stop-loss below the breakout level.
Range Trading
Range traders look for price to bounce between support and resistance.
This strategy can work when volatility is contained within a clear range.
However, range trading can fail when volatility expands and price breaks out strongly.
News Trading
News traders look for opportunities around major announcements.
Examples include:
- Earnings reports
- Inflation data
- Interest rate decisions
- Employment reports
- Inventory data
- Product announcements
News trading is risky because price can move sharply in both directions.
Mean Reversion Trading
Mean reversion traders expect price to return toward an average after moving too far.
Bollinger Bands are often used for this style. If price moves far above the upper band, a trader may watch for signs of exhaustion. If price moves below the lower band, a trader may watch for recovery.
This strategy can fail in strong trends because price can stay stretched for longer than expected.
Trend Following
Trend-following traders try to stay with strong directional moves.
Volatility can help trend followers when price breaks out and continues moving.
However, volatile trends can include sharp pullbacks. Traders need wider stops or smaller positions.
Trading Leveraged Products in Volatile Markets
Leveraged products increase exposure. They can magnify gains, but they can also magnify losses.
For example, if a trader uses 10:1 leverage, a 1% market move can create a 10% gain or loss on the trader’s capital exposure, depending on position structure and margin.
This makes leverage especially dangerous during volatile conditions.
The SEC has warned that leveraged and inverse products can involve greater risk and may not be suitable for all investors, especially when held longer than intended or during volatile periods.
Why Leverage Is Risky During Volatility
Leverage becomes risky because volatile markets can move quickly.
A trader may not have enough time to react. Stop-loss orders can slip. Spreads can widen. Margin requirements can increase. A position can be closed automatically if account equity falls too far.
This is why leveraged trading requires strict risk management.
Stop-Loss Orders and Volatility
A stop-loss can help limit risk, but it does not guarantee an exact exit price.
During fast markets, price may jump past the stop level. This is called slippage.
Stop-losses are still useful, but traders should understand their limits.
Position Sizing in Volatile Markets
Position sizing is one of the most important risk tools.
When volatility increases, traders often reduce position size.
Position Sizing Example
Assume a trader has a $2,000 account and wants to risk 1% per trade.
That means the maximum risk is $20.
If a calm market requires a $0.50 stop-loss, the trader can buy:
$20 ÷ $0.50 = 40 shares
If volatility rises and the stop-loss must be $1.00 away, the trader should reduce size:
$20 ÷ $1.00 = 20 shares
This keeps account risk the same even though the market is more volatile.
Risk Management for Volatility Trading
Volatility trading requires discipline.
Important rules include:
- Risk only a small percentage per trade.
- Use stop-losses based on market structure.
- Reduce size when volatility rises.
- Avoid overleveraging.
- Check spreads before entering.
- Avoid trading products you do not understand.
- Do not chase after large moves.
- Watch major news events.
- Use limit orders when liquidity is thin.
- Keep a trading journal.
Common Mistakes Traders Make With Volatility
Thinking Volatility Means Easy Profit
Volatility creates opportunity, but it also increases risk. A fast-moving market can move against a trader just as quickly as it can move in their favour.
Using Too Much Leverage
Leverage and volatility are a dangerous combination. Small price moves can create large losses.
Ignoring Liquidity
A volatile market with poor liquidity can create slippage, wide spreads, and bad fills.
Chasing Big Moves
A market that has already moved sharply may reverse. Late entries often have poor risk-reward.
Placing Stops Too Tight
In volatile markets, normal price noise can trigger tight stops. Traders may need wider stops and smaller size.
Trading Without a Catalyst
Not all price movement is meaningful. Traders should know why volatility is increasing.
Ignoring Correlations
During market stress, assets that usually move differently may begin falling together.
Best Practices for Trading Market Volatility
Start by identifying why volatility is rising.
Check whether the move is driven by news, data, policy, earnings, liquidity, or technical breakout.
Use wider stops only if you reduce position size.
Avoid entering immediately after a sharp spike unless your strategy is designed for it.
Do not trade markets you do not understand.
Keep your watchlist focused.
Use volatility indicators such as ATR, Bollinger Bands, and implied volatility, but do not rely on them alone.
Most importantly, protect capital. Surviving volatile markets matters more than catching every move.
Market Volatility and Long-Term Investors
Long-term investors should not ignore volatility, but they should view it differently from short-term traders.
Volatility can create fear. It can also create opportunity when quality assets fall below fair value.
Long-term investors may use volatility to:
- Rebalance portfolios
- Buy quality assets at lower prices
- Reduce overexposure to risky assets
- Review diversification
- Avoid emotional selling
However, long-term investors should avoid reacting to every short-term move. A portfolio plan should be based on goals, time horizon, risk tolerance, and asset allocation.
Market Volatility and Day Traders
Day traders often prefer volatility because it creates intraday movement.
However, day traders need:
- Fast execution
- Strong discipline
- Clear entry rules
- Defined stop-losses
- Realistic targets
- Awareness of news
- Strict daily loss limits
Without discipline, volatile markets can lead to revenge trading and large losses.
Key Takeaways
- Market volatility measures the speed and size of price movement.
- High volatility can create opportunity and risk.
- Volatility is often caused by uncertainty.
- Economic data, politics, earnings, central banks, and liquidity can all trigger volatility.
- Standard deviation, ATR, Bollinger Bands, implied volatility, and the VIX can measure volatility.
- Cryptocurrencies, commodities, exotic forex pairs, small-cap stocks, and growth stocks can be highly volatile.
- Lower-volatility assets may include cash, short-term government bonds, and defensive stocks.
- Leverage can magnify losses during volatile periods.
- Stop-losses help manage risk but may not prevent slippage.
- Position size should usually be reduced when volatility rises.
- Volatility does not predict direction.
- Risk management matters more than excitement.
Frequently Asked Questions
What is market volatility?
Market volatility is the rate and size of price movement in a financial market over a specific period.
Is high volatility good or bad?
High volatility is neither automatically good nor bad. It creates opportunity for some traders but increases risk.
What causes market volatility?
Volatility can be caused by economic data, central bank decisions, politics, company news, industry events, liquidity changes, and investor fear.
How is volatility measured?
Volatility can be measured using standard deviation, historical volatility, implied volatility, ATR, Bollinger Bands, and volatility indices such as the VIX.
What does the VIX measure?
The VIX measures expected near-term volatility in the S&P 500 based on options prices.
Which markets are most volatile?
Cryptocurrencies, commodities, exotic forex pairs, small-cap stocks, growth stocks, and leveraged products are often among the more volatile markets.
Are commodities volatile?
Yes. Commodities can be volatile because of weather, supply shocks, geopolitical events, inventories, and demand changes.
Is forex volatile?
Forex can move quickly, but major currency pairs are usually highly liquid. Exotic currency pairs often show higher volatility and wider spreads.
Why is crypto volatile?
Crypto can be volatile because of regulation news, sentiment, liquidity, leverage, exchange events, technology risks, and speculative flows.
How do traders manage volatility risk?
Traders manage volatility risk by reducing position size, using stop-losses, checking spreads, avoiding overleverage, and following a clear trading plan.
Can stop-losses fail in volatile markets?
A stop-loss may not execute at the exact expected price during fast markets. Slippage can occur.
Should beginners trade volatile markets?
Beginners should be cautious. Volatile markets require strong risk management, emotional control, and clear rules.
Conclusion
Market volatility is one of the main forces that shapes trading. It measures how quickly and sharply prices move, and it can appear in stocks, forex, commodities, crypto, bonds, and indices.
Volatility can create opportunity, but it also increases danger. A fast-moving market can reward a well-prepared trader and punish a careless one. That is why volatility should never be treated as easy money.
The best traders prepare before volatility rises. They understand the cause of the move, check liquidity, reduce position size when needed, and use clear risk rules. They know that stop-losses can help but may not always prevent slippage.
For long-term investors, volatility can create emotional pressure but also potential opportunity. For short-term traders, it can create active setups but demands discipline.
Market volatility is not something to fear blindly or chase recklessly. It is something to understand, measure, and manage.
Trading stocks, forex, commodities, crypto, options, futures, and leveraged products involves significant risk and may not be suitable for all investors. Prices can move quickly, and losses can exceed expectations when leverage is used. Past performance does not guarantee future results. Always conduct your own research and consider seeking independent financial advice.
Read Also: Triple Witching: Meaning and Trading Guide


