
In the early 1800s, multiple political entities in what is now Botswana were destabilized or destroyed by a series of conflicts and population movements in southern Africa. By the end of this period, the Tswana ethnic group, who also live across the border in South Africa, had become the most prominent group in the area. In 1852, Tswana forces halted the expansion of white Afrikaner settlers who were seeking to expand their territory northwards into what is now Botswana. In 1885, Great Britain claimed territory that roughly corresponds with modern day Botswana as a protectorate called Bechuanaland. Upon independence in 1966, the British protectorate of Bechuanaland adopted the new name of Botswana, which means “land of the Tswana.”
More than five decades of uninterrupted civilian leadership, progressive social policies, and significant capital investment have created an enduring democracy and upper-middle-income economy. The ruling Botswana Democratic Party has won every national election since independence; President Mokgweetsi Eric Keabetswe MASISI assumed the presidency in 2018 after the retirement of former President Ian KHAMA due to constitutional term limits. MASISI won his first election as president in 2019, and he is Botswana’s fifth president since independence. Mineral extraction, principally diamond mining, dominates economic activity, though tourism is a growing sector due to the country’s conservation practices and extensive nature preserves. Botswana has one of the world’s highest rates of HIV/AIDS infection but also one of Africa’s most progressive and comprehensive programs for dealing with the disease.
Geography
Location
Southern Africa, north of South Africa
Geographic coordinates
22 00 S, 24 00 E
Map references
Africa
Area
total : 581,730 sq km
land: 566,730 sq km
water: 15,000 sq km
comparison ranking: total 50
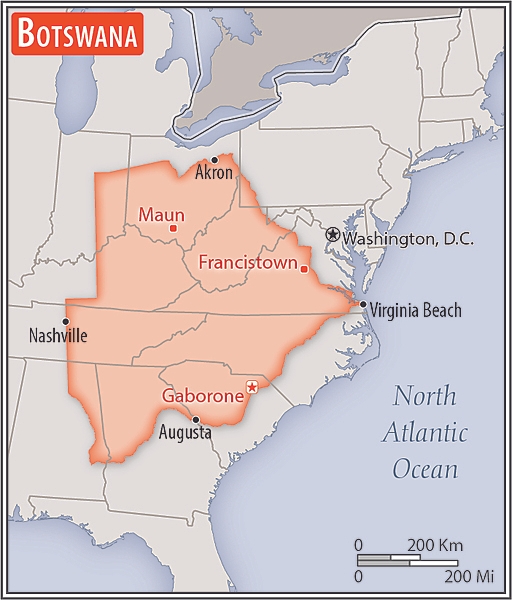
Area – comparative
slightly smaller than Texas; almost four times the size of Illinois
Area comparison map:
Land boundaries
total: 4,347.15 km
border countries (4): Namibia 1,544 km; South Africa 1,969 km; Zambia 0.15 km; Zimbabwe 834 km
Coastline
0 km (landlocked)
Maritime claims
none (landlocked)
Climate
semiarid; warm winters and hot summers
Terrain
predominantly flat to gently rolling tableland; Kalahari Desert in southwest
Elevation
highest point: Manyelanong Hill 1,495 m
lowest point: junction of the Limpopo and Shashe Rivers 513 m
mean elevation: 1,013 m
Natural resources
diamonds, copper, nickel, salt, soda ash, potash, coal, iron ore, silver
Land use
agricultural land: 45.6% (2022 est.)
arable land: 0.5% (2022 est.)
permanent crops: 0% (2022 est.)
permanent pasture: 45.2% (2022 est.)
forest: 26.5% (2022 est.)
other: 27.9% (2022 est.)
Irrigated land
25 sq km (2014)
Major rivers (by length in km)
Zambezi (shared with Zambia [s]), Angola, Namibia, Zimbabwe, and Mozambique [m]) – 2,740 km; Limpopo (shared with South Africa [s], Zimbabwe, and Mozambique [m]) – 1,800 km; Okavango river mouth (shared with Angola [s], and Namibia) – 1,600 km
note: [s] after country name indicates river source; [m] after country name indicates river mouth
Major watersheds (area sq km)
Atlantic Ocean drainage: Orange (941,351 sq km)
Indian Ocean drainage: Zambezi (1,332,412 sq km)
Internal (endorheic basin) drainage: Okavango Basin (863,866 sq km)
Major aquifers
Lower Kalahari-Stampriet Basin, Upper Kalahari-Cuvelai-Upper Zambezi Basin
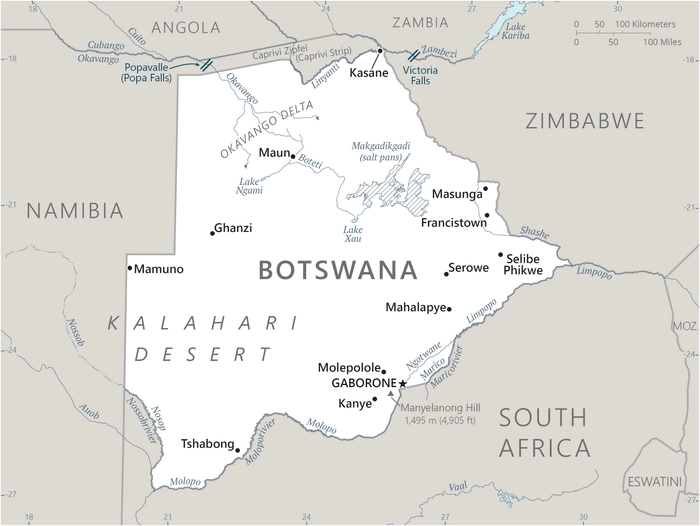
Population distribution
the population is primarily concentrated in the east, with a focus in and around the capital of Gaborone and the eastern city of Francistown; population density remains low in other areas in the country, especially in the Kalahari Desert to the west, as shown in this population distribution map
Natural hazards
periodic droughts; seasonal August winds blow from the west, carrying sand and dust across the country, which can obscure visibility
Geography – note
landlocked; sparsely populated with most settlement concentrated in the southern and eastern parts of the country; geography dominated by the Kalahari Desert, which covers about 70% of the country, although the Okavango Delta brings considerable biodiversity as one of the largest inland deltas in the World
People and Society
Population
total: 2,450,668 (2024 est.)
male: 1,174,306
female: 1,276,362
comparison rankings: total 146; female 143; male 146
Nationality
noun: Motswana (singular), Batswana (plural)
adjective: Motswana (singular), Batswana (plural)
Ethnic groups
Tswana (or Setswana) 79%, Kalanga 11%, Basarwa 3%, other, including Kgalagadi and people of European ancestry 7%
Languages
Setswana 77.3%, Sekalanga 7.4%, Shekgalagadi 3.4%, English (official) 2.8%, Zezuru/Shona 2%, Sesarwa 1.7%, Sembukushu 1.6%, Ndebele 1%, other 2.8% (2011 est.)
Religions
Christian 79.1%, Badimo 4.1%, other 1.4% (includes Baha’i, Hindu, Muslim, Rastafarian), none 15.2%, unspecified 0.3% (2011 est.)
Age structure
0-14 years: 28.7% (male 355,583/female 348,863)
15-64 years: 65.2% (male 759,210/female 837,752)
65 years and over: 6.1% (2024 est.) (male 59,513/female 89,747)
2024 population pyramid:

Dependency ratios
total dependency ratio: 53.5 (2024 est.)
youth dependency ratio: 44.1 (2024 est.)
elderly dependency ratio: 9.3 (2024 est.)
potential support ratio: 10.7 (2024 est.)
Median age
total: 27.1 years (2024 est.)
male: 26 years
female: 28.3 years
comparison ranking: total 161
Population growth rate
1.34% (2024 est.)
comparison ranking: 72
Birth rate
19.6 births/1,000 population (2024 est.)
comparison ranking: 72
Death rate
8.9 deaths/1,000 population (2024 est.)
comparison ranking: 62
Net migration rate
2.7 migrant(s)/1,000 population (2024 est.)
comparison ranking: 42
Population distribution
the population is primarily concentrated in the east, with a focus in and around the capital of Gaborone and the eastern city of Francistown; population density remains low in other areas in the country, especially in the Kalahari Desert to the west, as shown in this population distribution map
Urbanization
urban population: 72.9% of total population (2023)
rate of urbanization: 2.47% annual rate of change (2020-25 est.)
Major urban areas – population
269,000 GABORONE (capital) (2018)
Sex ratio
at birth: 1.03 male(s)/female
0-14 years: 1.02 male(s)/female
15-64 years: 0.91 male(s)/female
65 years and over: 0.66 male(s)/female
total population: 0.92 male(s)/female (2024 est.)
Maternal mortality ratio
186 deaths/100,000 live births (2020 est.)
comparison ranking: 48
Infant mortality rate
total: 23.7 deaths/1,000 live births (2024 est.)
male: 25.9 deaths/1,000 live births
female: 21.4 deaths/1,000 live births
comparison ranking: total 65
Life expectancy at birth
total population: 66.4 years (2024 est.)
male: 64.4 years
female: 68.6 years
comparison ranking: total population 201
Total fertility rate
2.34 children born/woman (2024 est.)
comparison ranking: 75
Gross reproduction rate
1.15 (2024 est.)
Contraceptive prevalence rate
67.4% (2017)
Drinking water source
improved:
urban: 98.1% of population
rural: 96.9% of population
total: 99.4% of population
unimproved:
urban: 0.2% of population
rural: 3.1% of population
total: 0.6% of population (2020 est.)
Health expenditure
6.3% of GDP (2021)
14.6% of national budget (2022 est.)
Physician density
0.38 physicians/1,000 population (2023)
Hospital bed density
2.2 beds/1,000 population (2021 est.)
Sanitation facility access
improved:
urban: 94.9% of population
rural: 63% of population
total: 85.6% of population
unimproved:
urban: 5.1% of population
rural: 37% of population
total: 14.4% of population (2020 est.)
Obesity – adult prevalence rate
18.9% (2016)
comparison ranking: 114
Alcohol consumption per capita
total: 5.98 liters of pure alcohol (2019 est.)
beer: 2.93 liters of pure alcohol (2019 est.)
wine: 0.46 liters of pure alcohol (2019 est.)
spirits: 0.96 liters of pure alcohol (2019 est.)
other alcohols: 1.64 liters of pure alcohol (2019 est.)
comparison ranking: total 71
Tobacco use
total: 17.1% (2025 est.)
male: 29.2% (2025 est.)
female: 5.5% (2025 est.)
comparison ranking: total 92
Children under the age of 5 years underweight
NA
Currently married women (ages 15-49)
45% (2023 est.)
Education expenditure
8.1% of GDP (2020 est.)
21.5% national budget (2020 est.)
comparison ranking: Education expenditure (% GDP) 11
Literacy
total population: 88.5%
male: 88%
female: 88.9% (2015)
School life expectancy (primary to tertiary education)
total: 12 years
male: 12 years
female: 12 years (2021)
Environment
Environment – current issues
overgrazing; desertification; limited freshwater resources; air pollution
Environment – international agreements
party to: Biodiversity, Climate Change, Climate Change-Kyoto Protocol, Climate Change-Paris Agreement, Desertification, Endangered Species, Hazardous Wastes, Law of the Sea, Nuclear Test Ban, Ozone Layer Protection, Wetlands
signed, but not ratified: none of the selected agreements
Climate
semiarid; warm winters and hot summers
Land use
agricultural land: 45.6% (2022 est.)
arable land: 0.5% (2022 est.)
permanent crops: 0% (2022 est.)
permanent pasture: 45.2% (2022 est.)
forest: 26.5% (2022 est.)
other: 27.9% (2022 est.)
Urbanization
urban population: 72.9% of total population (2023)
rate of urbanization: 2.47% annual rate of change (2020-25 est.)
Air pollutants
particulate matter emissions: 12.82 micrograms per cubic meter (2019 est.)
carbon dioxide emissions: 6.34 megatons (2016 est.)
methane emissions: 5.73 megatons (2020 est.)
Waste and recycling
municipal solid waste generated annually: 210,854 tons (2010 est.)
municipal solid waste recycled annually: 2,109 tons (2005 est.)
percent of municipal solid waste recycled: 1% (2005 est.)
Major rivers (by length in km)
Zambezi (shared with Zambia [s]), Angola, Namibia, Zimbabwe, and Mozambique [m]) – 2,740 km; Limpopo (shared with South Africa [s], Zimbabwe, and Mozambique [m]) – 1,800 km; Okavango river mouth (shared with Angola [s], and Namibia) – 1,600 km
note: [s] after country name indicates river source; [m] after country name indicates river mouth
Major watersheds (area sq km)
Atlantic Ocean drainage: Orange (941,351 sq km)
Indian Ocean drainage: Zambezi (1,332,412 sq km)
Internal (endorheic basin) drainage: Okavango Basin (863,866 sq km)
Major aquifers
Lower Kalahari-Stampriet Basin, Upper Kalahari-Cuvelai-Upper Zambezi Basin
Total water withdrawal
municipal: 110 million cubic meters (2020 est.)
industrial: 30 million cubic meters (2020 est.)
agricultural: 80 million cubic meters (2020 est.)
Total renewable water resources
12.24 billion cubic meters (2020 est.)
Government
Country name
conventional long form: Republic of Botswana
conventional short form: Botswana
local long form: Republic of Botswana
local short form: Botswana
former: Bechuanaland
etymology: the name Botswana means “Land of the Tswana,” referring to the country’s largest ethnic group
Government type
parliamentary republic
Capital
name: Gaborone
geographic coordinates: 24 38 S, 25 54 E
time difference: UTC+2 (7 hours ahead of Washington, DC, during Standard Time)
etymology: named after GABORONE (ca. 1825-1931), a chief of the Tlokwa tribe, whose name means “it is not unbecoming”
Administrative divisions
10 districts and 6 town councils*; Central, Chobe, Francistown*, Gaborone*, Ghanzi, Jwaneng*, Kgalagadi, Kgatleng, Kweneng, Lobatse*, North East, North West, Selebi-Phikwe*, South East, Southern, Sowa Town*
Legal system
mixed legal system of civil law influenced by the Roman-Dutch model, including customary and common law
Constitution
history: previous 1960 (pre-independence); latest adopted March 1965, effective 30 September 1966
amendment process: proposed by the National Assembly; passage requires approval in two successive Assembly votes with at least two-thirds majority in the final vote; proposals to amend constitutional provisions on fundamental rights and freedoms, the structure and branches of government, and public services also requires approval by majority vote in a referendum and assent by the president of the republic
International law organization participation
accepts compulsory ICJ jurisdiction with reservations; accepts ICCt jurisdiction
Citizenship
citizenship by birth: no
citizenship by descent only: at least one parent must be a citizen of Botswana
dual citizenship recognized: no
residency requirement for naturalization: 10 years
Suffrage
18 years of age; universal
Executive branch
chief of state: President Duma BOKO (since 1 November 2024)
head of government: President Duma BOKO (since 1 November 2024)
cabinet: Cabinet appointed by the president
elections/appointments: president indirectly elected by the National Assembly for a 5-year term (eligible for a second term); election last held on 31 October 2024 (next to be held in October 2029); vice president appointed by the president
election results: national elections held in 2024 gave BOKO’s UDC 35 seats in the National Assembly, which then selected BOKO as president
Legislative branch
legislature name: Parliament
legislative structure: unicameral
chamber name: National Assembly
number of seats: 69 (61 directly elected; 6 indirectly elected)
electoral system: plurality/majority
scope of elections: full renewal
term in office: 5 years
most recent election date: 10/30/2024
parties elected and seats per party: Umbrella for Democratic Change (UDC) (36); Botswana Congress Party (BCP) (15); Botswana Patriotic Front (BPF) (5); Botswana Democratic Party (BDP) (4); Other (1)
percentage of women in chamber: 8.7%
expected date of next election: October 2029
note: the House of Chiefs (Ntlo ya Dikgosi), an advisory body to the National Assembly, consists of 35 members — 8 hereditary chiefs from Botswana’s principal tribes, 22 indirectly elected by the chiefs, and 5 appointed by the president; the House of Chiefs consults on issues including powers of chiefs, customary courts, customary law, tribal property, and constitutional amendments
Judicial branch
highest court(s): Court of Appeal, High Court (each consists of a chief justice and a number of other judges as prescribed by the Parliament)
judge selection and term of office: Court of Appeal and High Court chief justices appointed by the president and other judges appointed by the president upon the advice of the Judicial Service Commission; all judges appointed to serve until age 70
subordinate courts: Industrial Court (with circuits scheduled monthly in the capital city and in 3 districts); Magistrates Courts (1 in each district); Customary Court of Appeal; Paramount Chief’s Court/Urban Customary Court; Senior Chief’s Representative Court; Chief’s Representative’s Court; Headman’s Court
Political parties
Alliance of Progressives or AP
Botswana Congress Party or BCP
Botswana Democratic Party or BDP
Botswana National Front or BNF [Duma BOKO]Botswana Patriotic Front or BPF
Botswana Peoples Party or BPP
Botswana Republic Party or BRP
Umbrella for Democratic Change or UDC (various times the coalition has included the BPP, BCP, BNF and other parties)
Diplomatic representation in the US
chief of mission: Ambassador Mpho Churchill MOPHUTING (since 18 September 2024)
chancery: 1531-1533 New Hampshire Avenue NW, Washington, DC 20036
telephone: [1] (202) 244-4990
FAX: [1] (202) 244-4164
email address and website:
[email protected]
http://www.botswanaembassy.org/
Diplomatic representation from the US
chief of mission: Ambassador Howard A. VAN VRANKEN (since 24 May 2023)
embassy: Embassy Drive, Government Enclave (off Khama Crescent), Gaborone
mailing address: 2170 Gaborone Place, Washington DC 20521-2170
telephone: [267] 395-3982
FAX: [267] 318-0232
email address and website:
[email protected]
https://bw.usembassy.gov/
International organization participation
ACP, AfDB, AU, C, CD, FAO, G-77, IAEA, IBRD, ICAO, ICCt, ICRM, IDA, IFAD, IFC, IFRCS, ILO, IMF, Interpol, IOC, IOM, IPU, ISO, ITSO, ITU, ITUC (NGOs), MIGA, MONUSCO, NAM, OPCW, SACU, SADC, UN, UNCTAD, UNESCO, UNIDO, UNWTO, UPU, WCO, WFTU (NGOs), WHO, WIPO, WMO, WTO
Independence
30 September 1966 (from the UK)
National holiday
Independence Day (Botswana Day), 30 September (1966)
Flag description
light blue with a horizontal white-edged black stripe in the center; the blue symbolizes water in the form of rain, and the black and white bands represent racial harmony
National symbol(s)
zebra
National colors
light blue, white, black
National coat of arms
the two zebras, the country’s national symbol, support an elephant tusk that represents the country’s fauna and a head of sorghum that signifies agriculture; the three wavy blue bands stand for the country’s reliance on water, the cog wheels for industry, and the bull’s head for the cattle industry; the coat of arms also features the national colors of light blue, white, and black; the motto reflects the scarcity of rain in the country: pula means “let there be rain” in Setswana, the national language

National anthem
name: “Fatshe leno la rona” (Our Land)
lyrics/music: Kgalemang Tumedisco MOTSETE
note: adopted 1966
National heritage
total World Heritage Sites: 2 (1 cultural, 1 natural)
selected World Heritage Site locales: Tsodilo Hills (c); Okavango Delta (n)
Economy
Economic overview
good economic governance and financial management; diamond-driven growth model declining; rapid poverty reductions; high unemployment, particularly among youth; COVID-19 sharply contracted the economy and recovery is slow; public sector wages have posed fiscal challenges
Real GDP (purchasing power parity)
$46.743 billion (2023 est.)
$45.499 billion (2022 est.)
$43.133 billion (2021 est.)
note: data in 2021 dollars
comparison ranking: 128
Real GDP growth rate
2.73% (2023 est.)
5.49% (2022 est.)
11.92% (2021 est.)
note: annual GDP % growth based on constant local currency
comparison ranking: 115
Real GDP per capita
$18,800 (2023 est.)
$18,600 (2022 est.)
$18,000 (2021 est.)
note: data in 2021 dollars
comparison ranking: 105
GDP (official exchange rate)
$19.396 billion (2023 est.)
note: data in current dollars at official exchange rate
Inflation rate (consumer prices)
2.8% (2024 est.)
5.1% (2023 est.)
11.7% (2022 est.)
note: annual % change based on consumer prices
comparison ranking: 90
GDP – composition, by sector of origin
agriculture: 1.6% (2023 est.)
industry: 34.3% (2023 est.)
services: 59.4% (2023 est.)
note: figures may not total 100% due to non-allocated consumption not captured in sector-reported data
comparison rankings: services 95; industry 43; agriculture 172
GDP – composition, by end use
household consumption: 42.9% (2023 est.)
government consumption: 28.9% (2023 est.)
investment in fixed capital: 25.7% (2023 est.)
investment in inventories: 4.7% (2023 est.)
exports of goods and services: 32.3% (2023 est.)
imports of goods and services: -36.6% (2023 est.)
note: figures may not total 100% due to rounding or gaps in data collection
Agricultural products
root vegetables, beef, vegetables, sorghum, maize, game meat, milk, watermelons, goat milk, sunflower seeds (2023)
note: top ten agricultural products based on tonnage
Industries
diamonds, copper, nickel, salt, soda ash, potash, coal, iron ore, silver; beef processing; textiles
Industrial production growth rate
2.26% (2023 est.)
note: annual % change in industrial value added based on constant local currency
comparison ranking: 112
Labor force
1.173 million (2024 est.)
note: number of people ages 15 or older who are employed or seeking work
comparison ranking: 143
Unemployment rate
23.1% (2024 est.)
23.4% (2023 est.)
23.6% (2022 est.)
note: % of labor force seeking employment
comparison ranking: 195
Youth unemployment rate (ages 15-24)
total: 43.9% (2024 est.)
male: 39.8% (2024 est.)
female: 48.6% (2024 est.)
note: % of labor force ages 15-24 seeking employment
comparison ranking: total 6
Population below poverty line
16.1% (2015 est.)
note: % of population with income below national poverty line
Gini Index coefficient – distribution of family income
53.3 (2015 est.)
note: index (0-100) of income distribution; higher values represent greater inequality
comparison ranking: 6
Household income or consumption by percentage share
lowest 10%: 1.5% (2015 est.)
highest 10%: 41.5% (2015 est.)
note: % share of income accruing to lowest and highest 10% of population
Remittances
0.36% of GDP (2023 est.)
0.31% of GDP (2022 est.)
0.32% of GDP (2021 est.)
note: personal transfers and compensation between resident and non-resident individuals/households/entities
Budget
revenues: $5.989 billion (2022 est.)
expenditures: $5.099 billion (2022 est.)
note: central government revenues and expenses (excluding grants/extrabudgetary units/social security funds) converted to US dollars at average official exchange rate for year indicated
Public debt
19.6% of GDP (2020 est.)
note: central government debt as a % of GDP
comparison ranking: 188
Taxes and other revenues
19.6% (of GDP) (2022 est.)
note: central government tax revenue as a % of GDP
comparison ranking: 88
Current account balance
-$116.727 million (2023 est.)
-$232.122 million (2022 est.)
-$314.583 million (2021 est.)
note: balance of payments – net trade and primary/secondary income in current dollars
comparison ranking: 99
Exports
$6.398 billion (2023 est.)
$8.914 billion (2022 est.)
$7.861 billion (2021 est.)
note: balance of payments – exports of goods and services in current dollars
comparison ranking: 129
Exports – partners
UAE 27%, India 17%, Belgium 16%, South Africa 8%, USA 7% (2023)
note: top five export partners based on percentage share of exports
Exports – commodities
diamonds, copper ore, insulated wire, carbonates, cattle (2023)
note: top five export commodities based on value in dollars
Imports
$7.228 billion (2023 est.)
$8.826 billion (2022 est.)
$9.25 billion (2021 est.)
note: balance of payments – imports of goods and services in current dollars
comparison ranking: 137
Imports – partners
South Africa 65%, Namibia 8%, Canada 5%, China 3%, India 3% (2023)
note: top five import partners based on percentage share of imports
Imports – commodities
refined petroleum, diamonds, cars, flavored water, electricity (2023)
note: top five import commodities based on value in dollars
Reserves of foreign exchange and gold
$4.756 billion (2023 est.)
$4.279 billion (2022 est.)
$4.802 billion (2021 est.)
note: holdings of gold (year-end prices)/foreign exchange/special drawing rights in current dollars
comparison ranking: 104
Debt – external
$1.761 billion (2023 est.)
note: present value of external debt in current US dollars
comparison ranking: 98
Exchange rates
pulas (BWP) per US dollar –
Exchange rates:
13.563 (2024 est.)
13.596 (2023 est.)
12.369 (2022 est.)
11.087 (2021 est.)
11.456 (2020 est.)
Energy
Electricity access
electrification – total population: 75.9% (2022 est.)
electrification – urban areas: 95.5%
electrification – rural areas: 25%
Electricity
installed generating capacity: 758,000 kW (2023 est.)
consumption: 3.879 billion kWh (2023 est.)
exports: 2 million kWh (2023 est.)
imports: 1.923 billion kWh (2023 est.)
transmission/distribution losses: 625.694 million kWh (2023 est.)
comparison rankings: transmission/distribution losses 87; imports 67; exports 102; consumption 137; installed generating capacity 143
Electricity generation sources
fossil fuels: 99.8% of total installed capacity (2023 est.)
solar: 0.2% of total installed capacity (2023 est.)
Coal
production: 2.242 million metric tons (2023 est.)
consumption: 1.351 million metric tons (2023 est.)
exports: 891,000 metric tons (2023 est.)
imports: 300 metric tons (2023 est.)
proven reserves: 1.66 billion metric tons (2023 est.)
Petroleum
refined petroleum consumption: 22,000 bbl/day (2023 est.)
Carbon dioxide emissions
5.897 million metric tonnes of CO2 (2023 est.)
from coal and metallurgical coke: 2.818 million metric tonnes of CO2 (2023 est.)
from petroleum and other liquids: 3.079 million metric tonnes of CO2 (2023 est.)
comparison ranking: total emissions 131
Energy consumption per capita
32.443 million Btu/person (2023 est.)
comparison ranking: 113
Communications
Telephones – fixed lines
total subscriptions: 90,000 (2023 est.)
subscriptions per 100 inhabitants: 4 (2023 est.)
comparison ranking: total subscriptions 137
Telephones – mobile cellular
total subscriptions: 4.44 million (2023 est.)
subscriptions per 100 inhabitants: 165 (2022 est.)
comparison ranking: total subscriptions 131
Broadcast media
2 TV stations, 1 state-owned and 1 privately owned; privately owned satellite TV subscription service is available; 2 state-owned national radio stations; 4 privately owned radio stations broadcast locally (2019)
Internet country code
.bw
Internet users
percent of population: 81% (2023 est.)
Broadband – fixed subscriptions
total: 85,000 (2023 est.)
subscriptions per 100 inhabitants: 3 (2023 est.)
comparison ranking: total 138
Transportation
Civil aircraft registration country code prefix
A2
Airports
122 (2025)
comparison ranking: 42
Railways
total: 888 km (2014)
narrow gauge: 888 km (2014) 1.067-m gauge
Military and Security
Military and security forces
Botswana Defense Force (BDF): Ground Forces Command, Air Arm Command, Defense Logistics Command (2025)
note 1: both the BDF and the Botswana Police Service (BPS) report to the Ministry of Defense, Justice and Security; the BPS has primary responsibility for internal security
note 2: the Ground Force Command includes a marine unit with boats and river craft for patrolling Botswana’s internal waterways and supporting anti-poaching operations
Military expenditures
2.9% of GDP (2024 est.)
2.6% of GDP (2023 est.)
2.8% of GDP (2022 est.)
3% of GDP (2021 est.)
3% of GDP (2020 est.)
Military and security service personnel strengths
estimated 10,000 active Botswana Defense Force (2025)
Military equipment inventories and acquisitions
the BDF has a mix of mostly older weapons and equipment, largely of Western/European origin; in recent years, it has received limited amounts of material from several European countries and the US (2024)
Military service age and obligation
18 is the legal minimum age for voluntary military service for men and women; no conscription (2024)
Military – note
the key responsibilities of the Botswana Defense Force (BDF) are defending the country’s sovereignty and territorial integrity on land and in the air, ensuring national security and stability, and aiding civil authorities in support of domestic missions such as disaster relief and anti-poaching; the BDF also participates in regional and international security operations
Bechuanaland/Botswana did not have a permanent military during colonial times, with the British colonial administrators relying instead on small, lightly armed constabularies such as the Bechuanaland Mounted Police, the Bechuanaland Border Police, and by the early 1960s, the Police Mobile Unit (PMU); after independence in 1966, Botswana militarized the PMU and gave it responsibility for the country’s defense rather than create a conventional military force; however, turmoil in neighboring countries and numerous cross-border incursions by Rhodesian and South African security forces in the 1960s and 1970s demonstrated that the PMU was inadequate for defending the country and led to the establishment of the BDF in 1977 (2025)


