Kenya is divided into 47 counties, each governed by a county government as stipulated in the 2010 Constitution. Population estimates for 2023 show significant demographic shifts, reflecting urban migration, birth rates, and changing social dynamics. While the last official census was conducted in 2019, the 2023 figures are estimates based on historical growth trends and statistical modeling by the Kenya National Bureau of Statistics (KNBS) and external agencies. Kenyan counties by population
This article presents a full breakdown of Kenyan counties by population in 2023, alongside data from the national censuses of 2019, 2009, 1999, 1989, and 1979 where available. This allows for a detailed understanding of long-term demographic trends in Kenya.
Population Table: 47 Kenyan Counties (1979–2023)
The table below offers a side-by-side comparison of population estimates for 2023 and historical census data:
| Rank | County | 2023 Estimate | 2019 Census | 2009 Census | 1999 Census | 1989 Census | 1979 Census |
|---|---|---|---|---|---|---|---|
| 1 | Nairobi | 4,434,756 | 4,397,073 | 3,138,369 | 2,143,254 | 1,324,570 | 827,775 |
| 2 | Kiambu | 2,652,880 | 2,417,735 | 1,623,282 | 1,389,723 | 914,412 | 686,290 |
| 3 | Nakuru | 2,347,849 | 2,162,202 | 1,603,325 | 1,187,039 | 849,096 | 522,709 |
| 4 | Kakamega | 2,002,435 | 1,867,579 | 1,660,651 | 1,296,270 | — | — |
| 5 | Bungoma | 1,786,973 | 1,670,570 | 1,375,063 | 1,011,524 | 679,146 | 503,935 |
| 6 | Meru | 1,625,982 | 1,545,714 | 1,356,301 | 1,102,930 | — | — |
| 7 | Kilifi | 1,577,335 | 1,453,787 | 1,109,735 | 825,855 | 591,903 | 430,986 |
| 8 | Machakos | 1,487,758 | 1,421,932 | 1,098,584 | 906,644 | — | — |
| 9 | Kisii | 1,344,907 | 1,266,860 | 1,152,282 | 952,725 | — | — |
| 10 | Mombasa | 1,311,860 | 1,208,333 | 939,370 | 665,018 | 461,753 | 341,148 |
| 11 | Narok | 1,284,204 | 1,157,873 | 850,920 | 536,341 | 398,272 | 210,306 |
| 12 | Kajiado | 1,268,261 | 1,117,840 | 687,312 | 406,054 | 258,659 | 149,005 |
| 13 | Uasin Gishu | 1,257,330 | 1,163,186 | 894,179 | 622,705 | 445,530 | 300,766 |
| 14 | Kisumu | 1,248,474 | 1,155,574 | 968,909 | 804,289 | 664,086 | 482,327 |
| 15 | Migori | 1,234,082 | 1,116,436 | 917,170 | 666,784 | — | — |
| 16 | Homa Bay | 1,231,659 | 1,131,950 | 963,794 | 751,332 | — | — |
| 17 | Kitui | 1,229,790 | 1,136,187 | 1,012,709 | 819,250 | 652,603 | 464,283 |
| 18 | Murang’a | 1,112,288 | 1,056,640 | 942,581 | 736,273 | 858,063 | 648,333 |
| 19 | Trans-Nzoia | 1,069,039 | 990,341 | 818,757 | 575,662 | 393,682 | 259,503 |
| 20 | Siaya | 1,059,458 | 993,183 | 842,304 | 718,964 | 639,439 | 474,516 |
| 21 | Makueni | 1,042,300 | 987,653 | 884,527 | 771,545 | — | — |
| 22 | Turkana | 1,022,773 | 926,976 | 855,399 | 450,860 | 184,060 | 142,702 |
| 23 | Busia | 968,763 | 893,681 | 743,946 | 552,099 | 401,658 | 297,841 |
| 24 | Mandera | 959,236 | 867,457 | 1,025,756 | 250,372 | 123,787 | 105,601 |
| 25 | Kericho | 954,896 | 901,777 | 752,396 | — | — | — |
| 26 | Nandi | 951,460 | 885,711 | 752,965 | 578,751 | 433,613 | 299,319 |
| 27 | Kwale | 944,464 | 866,820 | 649,931 | 496,133 | 383,053 | 288,363 |
| 28 | Bomet | 939,761 | 875,689 | 730,129 | — | — | — |
| 29 | Garissa | 927,031 | 841,353 | 623,060 | 392,510 | 124,835 | 128,867 |
| 30 | Wajir | 870,636 | 781,263 | 661,941 | 319,261 | 122,769 | 139,319 |
| 31 | Nyeri | 835,408 | 759,164 | 693,558 | 661,156 | 607,292 | 486,477 |
| 32 | Baringo | 733,333 | 666,763 | 555,561 | 403,141 | 347,990 | 203,792 |
| 33 | Nyandarua | 695,531 | 638,289 | 596,268 | 479,902 | 345,420 | 233,302 |
| 34 | West Pokot | 676,326 | 621,241 | 512,690 | 308,086 | 225,449 | 158,652 |
| 35 | Nyamira | 657,502 | 605,576 | 598,252 | 498,102 | — | — |
| 36 | Kirinyaga | 653,112 | 610,411 | 528,054 | 457,105 | 391,516 | 291,431 |
| 37 | Embu | 648,425 | 608,599 | 516,212 | 449,149 | 370,138 | 263,173 |
| 38 | Vihiga | 625,765 | 590,013 | 554,622 | 498,883 | — | — |
| 39 | Laikipia | 561,223 | 518,560 | 399,227 | 322,187 | 218,957 | 134,524 |
| 40 | Marsabit | 515,292 | 459,785 | 291,166 | 174,957 | 129,262 | 96,216 |
| 41 | Elgeyo-Marakwet | 495,239 | 454,480 | 369,998 | 284,494 | 216,487 | 148,868 |
| 42 | Tharaka-Nithi | 416,383 | 393,177 | 365,330 | 306,443 | — | — |
| 43 | Taita-Taveta | 363,990 | 340,671 | 284,657 | 246,671 | 207,273 | 147,597 |
| 44 | Tana River | 352,549 | 315,943 | 240,075 | 180,901 | 128,426 | 92,401 |
| 45 | Samburu | 348,298 | 310,327 | 223,947 | 143,547 | 108,884 | 76,908 |
| 46 | Isiolo | 315,937 | 268,002 | 143,294 | 100,861 | 70,078 | 43,478 |
| 47 | Lamu | 167,332 | 143,920 | 101,539 | 72,686 | 56,783 | 42,299 |
Key Insights from the 2023 Population Estimates
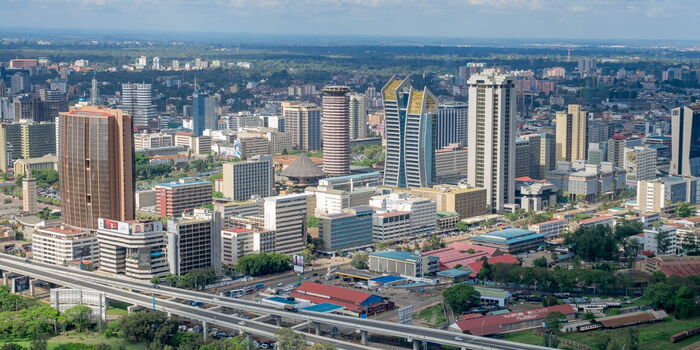
1. Nairobi County Remains Most Populated
With over 4.43 million people, Nairobi continues to be Kenya’s most densely populated county. Urbanization and rural-to-urban migration have kept Nairobi at the top for decades.
2. Kiambu and Nakuru Follow Closely
Kiambu and Nakuru counties are second and third, with 2.65 million and 2.35 million people, respectively. Both benefit from proximity to Nairobi and have rapidly urbanizing centers like Thika and Naivasha.
3. High Growth in Narok, Kajiado, and Uasin Gishu
Counties like Narok, Kajiado, and Uasin Gishu have witnessed sharp population increases due to improved infrastructure, land availability, and regional development.
4. Low Population in Northern and Coastal Counties
Lamu, Isiolo, Tana River, and Samburu remain among the least populated counties. Sparse settlement patterns, arid climates, and limited infrastructure contribute to this trend.
Historical Population Trends
- Urban counties (e.g., Nairobi, Mombasa, Kisumu) have consistently shown high density, influenced by migration and economic activities.
- Rural counties with agricultural dominance (e.g., Kakamega, Bungoma) show steady but modest growth.
- Arid and semi-arid regions (ASALs) like Turkana and Marsabit saw relative population increases post-devolution due to improved health and education access.
Methodology for the 2023 Estimates
These 2023 figures are projections, not official census results. They are derived using:
- Intercensal growth rates from previous censuses.
- Fertility and mortality trends tracked by the Ministry of Health.
- Migration and settlement modeling using household surveys and urban development data.
The next national census is expected in 2029, which will provide official updates and re-baselining of county populations.
Why County-Level Data Matters
Understanding county populations helps with:
- Resource allocation through the equitable share formula.
- Planning for healthcare, education, and housing.
- Electoral boundary reviews and constituency creation.
- Investment decisions by public and private sectors.
Conclusion
Population growth in Kenya reflects deep regional inequalities and urbanization trends. While counties like Nairobi, Kiambu, and Nakuru continue to dominate demographically, rising figures in formerly low-populated counties indicate an evolving settlement pattern post-devolution. Continuous tracking of this data is crucial for sustainable planning and national development.


